Knowledge graphs as a means to critically describe museum collections – workshop for students of Curating Data.
Students on the course Curating Data, which is part of Critical Data Studies elective program at Aarhus University, had an opportunity to participate in a workshop with Lukas Fuchsgruber.

Students on the course Curating Data, which is part of Critical Data Studies elective program at Aarhus University, had an opportunity to participate in a workshop with Lukas Fuchsgruber. Dr Fuchsgruber is an art historian at the Technical University Berlin. Currently he is part of a collaborative project of museums and universities in Berlin, with a case study on the politics and social aspects of digital collections. He is also associated researcher with the Centre for the Critical Data Practices.
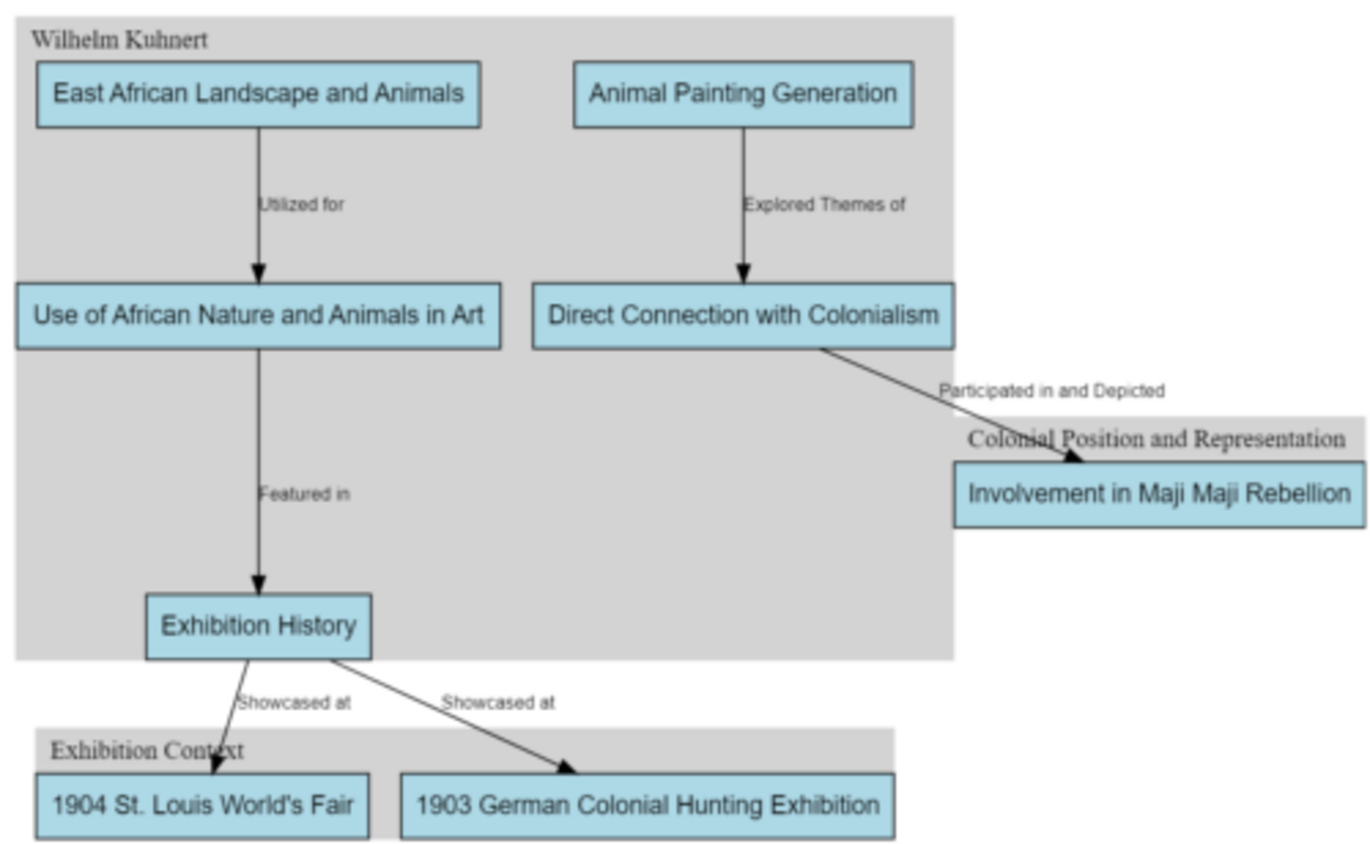
The workshop was conceptualized as a collaboration between critical collection studies and critical data studies, and it took place on the 9th October as a hybrid session. The idea was to look at social issues in art museums and think about the role of data. Students read short descriptions of social issues in 19th-century paintings and then tried to map them as a graph. Based on the research done by students of art history at TUB and Fuchsgruber’s research on painting collections, curating data students were given a task to produce critical diagrams of the social context for a small group of paintings.
This exercise was meant as an intervention against the usual concept of museum databases, where there is only a very limited scope of metadata – e.g. artist name, date, title, medium, provenance – and then a description in the online catalogue, very often lacking a deeper assessment of the social function of art and collecting.
One of the graphs created during the workshop was based on a TUB students publication titled “Images of the World” which had come out of a seminar together with Freya Schwachenwald in the summer term 2022. Graphs developed in Aarhus used Graphviz, open source visualisation software, which meant that they were written as code of nodes and edges that are then rendered as a diagram. Such an approach allows to think of critical arguments as logical concepts and contextualizations that can be mapped. This method contributes towards bringing these arguments and concepts in touch with museum data, which could be done for example in a semantic web environment such as Wikidata.
This is an edited version of the post originally written by Lukas Fuchsgruber and published on https://nullmuseum.hypotheses.org/938 in October 2023.
